Currently 1 visitor is viewing this site.

Under construction ...

At the present this is German only. Will translate this in the future.
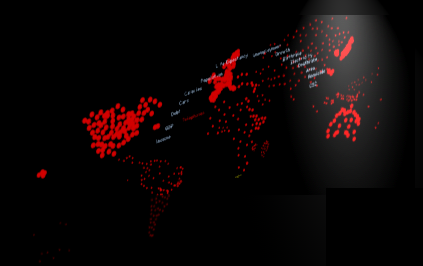
It is the documentation of an old data-visualisation project done with Director and was never properly documented. It visualises statistics on a global map, but not by distorting the continents but through setting the blend of 1200 dots (60% in Asia). The data are expenditure of education, number of telephones, number of cars, per capita income and mixes of the data, such as literacy and number of children etc.. This was done in 1999-2000.

Mapping 10k cities from a text file onto the map via their lat/lon:

last update: 9/6/02011 11:55

About Contact Disclaimer Glossary Index